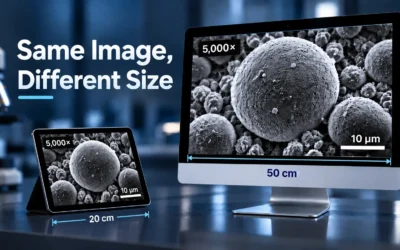
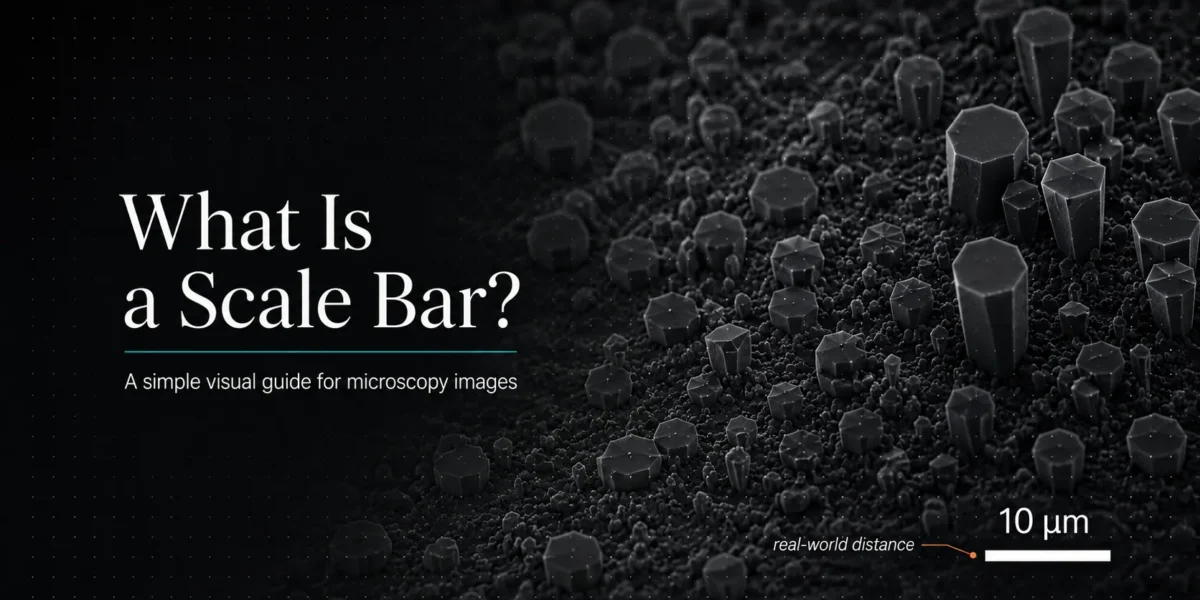
A scale bar in a microscopy image shows the real-world distance represented inside the image. Instead of relying only on magnification, the scale bar tells the reader how large a feature actually is, usually in nm, µm, mm, or another physical unit.
For example, if a scale bar is labeled 10 µm, the length of that bar in the image represents 10 micrometers in the real sample.
Why scale bars matter
A microscopy image without a scale bar can look interesting, but it does not clearly communicate size.
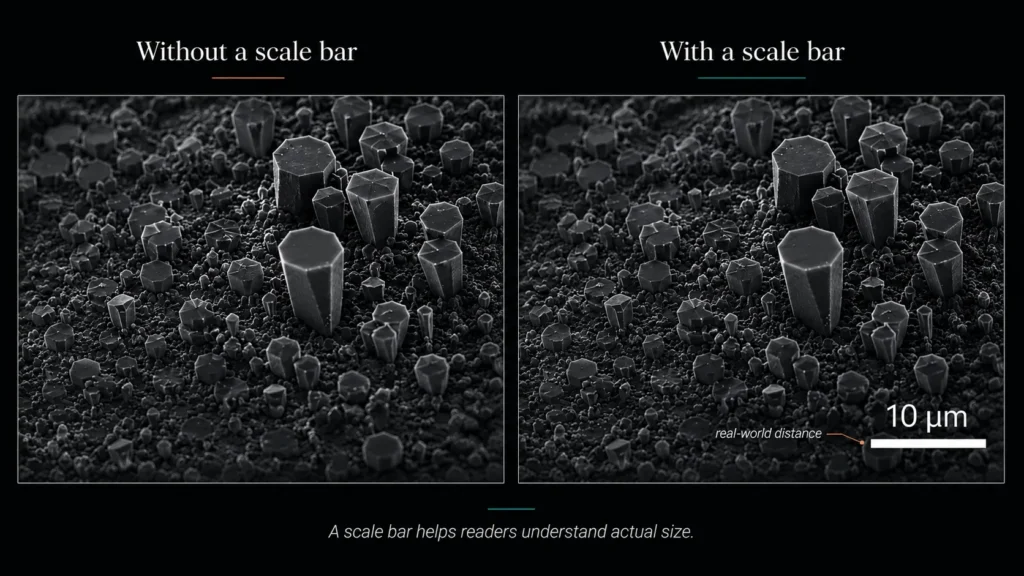
This matters when you need to:
- compare particle size, grain size, pores, fibers, or cells
- prepare SEM, TEM, or optical microscopy images for a paper
- create a thesis figure or presentation slide
- measure features from an image
- show results to readers who do not know the original magnification
A scale bar makes the image easier to understand because it connects pixels to real-world distance.
Scale bar vs magnification
Magnification tells you how much the image was enlarged during capture or display. A scale bar tells you the actual distance inside the sample.
For scientific figures, the scale bar is usually more reliable for readers because the image may be resized later in Word, PowerPoint, a journal template, or a figure layout tool.
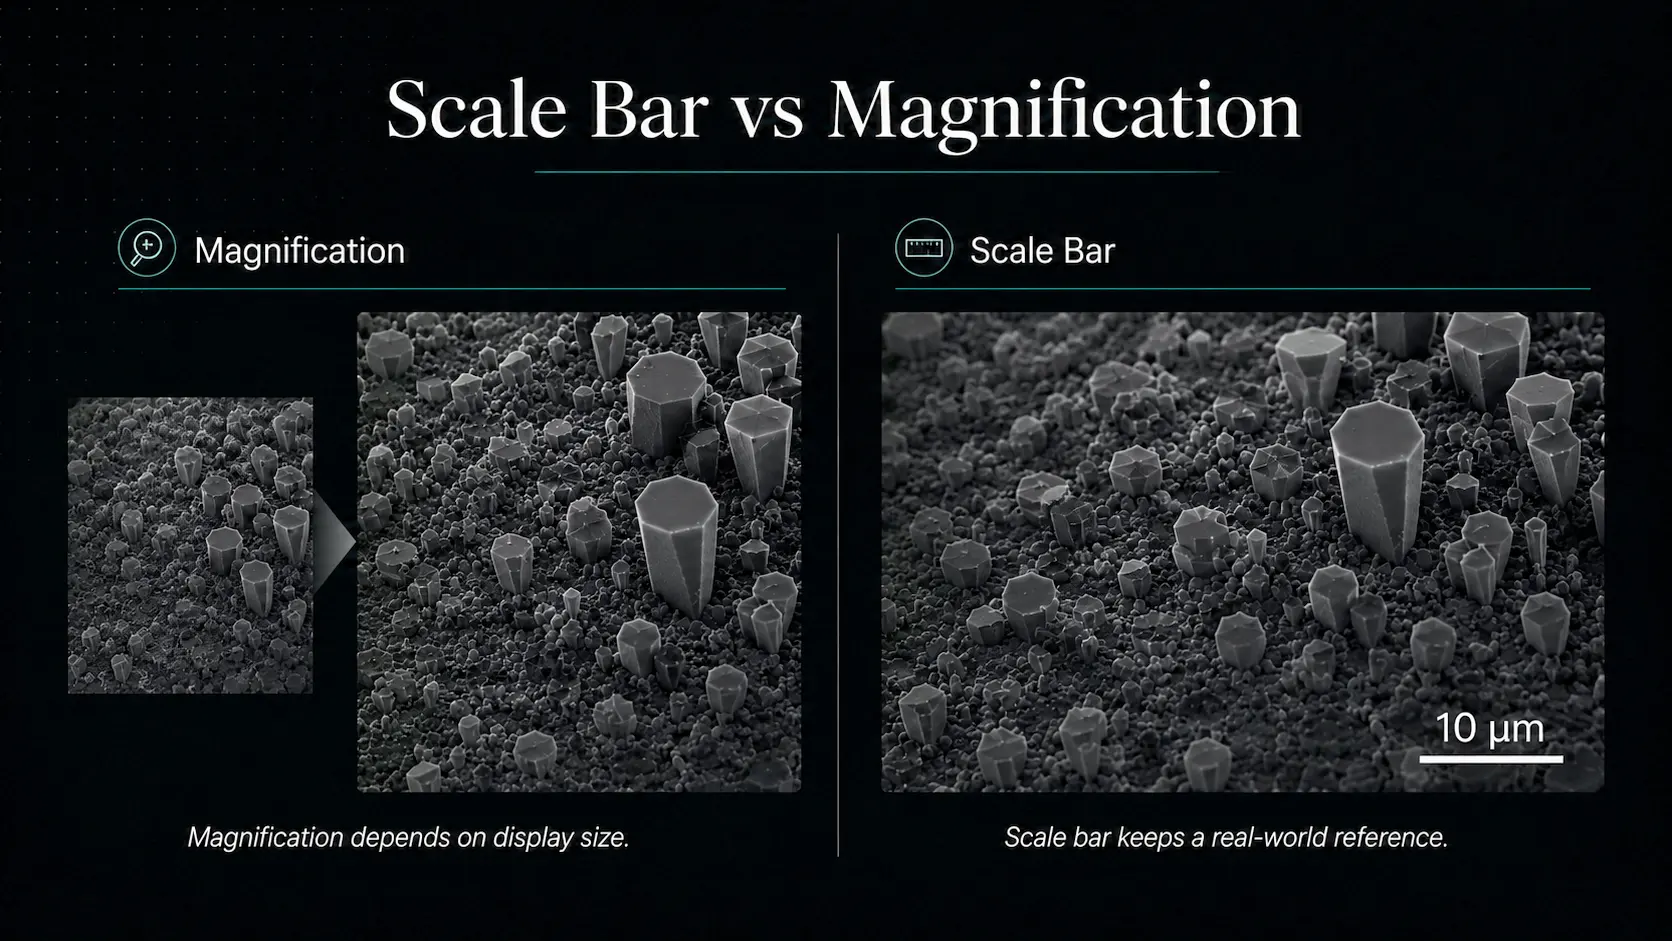
If the image is resized, the written magnification may become less useful. A correctly attached scale bar remains visually meaningful as long as it is resized together with the image.
Common units used in microscopy scale bars
The unit depends on the image type and sample size.
| Image type | Common scale bar units |
|---|---|
| SEM image | nm, µm |
| TEM image | nm |
| Optical microscopy image | µm, mm |
| Metallography image | µm, mm |
| Macro image | mm, cm |
For most SEM images, 1 µm, 5 µm, 10 µm, or 100 µm scale bars are common, depending on the field of view.
Where should a scale bar be placed?
A scale bar is usually placed in one corner of the image, often bottom-left or bottom-right.
Good placement should follow three rules:
- It should be easy to read.
- It should not cover important sample features.
- It should be consistent across related images.

For dark microscopy images, a white scale bar is often readable. For bright images, a black scale bar may work better. If the background is complex, a boxed or semi-transparent background can improve readability.
Common mistakes
1. Adding a scale bar without calibration
A scale bar should be based on a known pixel-to-distance ratio. If the image is not calibrated, the scale bar may look correct but represent the wrong distance.
2. Resizing the image after adding a static scale bar
If the scale bar is added as a separate graphic and the image is resized incorrectly, the scale may no longer be accurate.
3. Using only magnification
Magnification can be useful, but it is not enough for a final figure. Readers usually need a visible scale bar.
4. Choosing a scale bar that is too long or too short
A scale bar should be readable but not dominate the image. A good rule is to keep it visible and proportional to the field of view.
Tools you can use
You can add scale bars using tools such as ImageJ/Fiji, microscopy software, Illustrator, PowerPoint, or dedicated scientific figure tools.
For a more structured workflow, tools like NotyLab can help you calibrate an image, add a scale bar, keep styles consistent, arrange microscopy images into panels, and export publication-ready figures.
Quick checklist
Before using a microscopy image in a paper or thesis, check:
- Does the image have a visible scale bar?
- Is the unit correct?
- Is the scale bar based on calibration?
- Is the label readable?
- Does it avoid important image details?
- Is the style consistent with other images?