
Freemium

XRD · FTIR · Raman · UV-Vis · DSC · TGA · Mechanical

NotyPlot: Scientific Plotting & Peak Analysis

Analyze XRD, FTIR, Raman, UV-Vis, thermal and mechanical data. Detect and fit peaks, compare datasets and create publication-ready plots with NotyPlot

Go beyond plotting. Get the numbers behind the curve.

A useful scientific plot should help you inspect the signal, verify the analysis and extract the result you actually need.

  1. 1Import and map experimental data
  2. 2Inspect the signal and preprocessing
  3. 3Detect peaks, bands or transitions
  4. 4Fit or calculate the selected scientific result
  5. 5Compare samples and review the result
  6. 6Export a clear publication-ready plot

From raw experimental data to interpretable results

Import scientific data, inspect the signal, apply the analysis that matches your technique, and keep the settings and results connected to the plot. NotyPlot is designed for researchers who need more than a chart: it helps you move from raw data to reviewable quantitative results.

Start with the scientific task

Use a guided Workflow when you want a defined result such as XRD peak fitting, Scherrer crystallite size, a Tauc band-gap estimate, FTIR band review, Raman peak detection, TGA/DTG analysis or stress-strain properties. Switch to Tool mode when you want direct control of the plot and analysis settings.
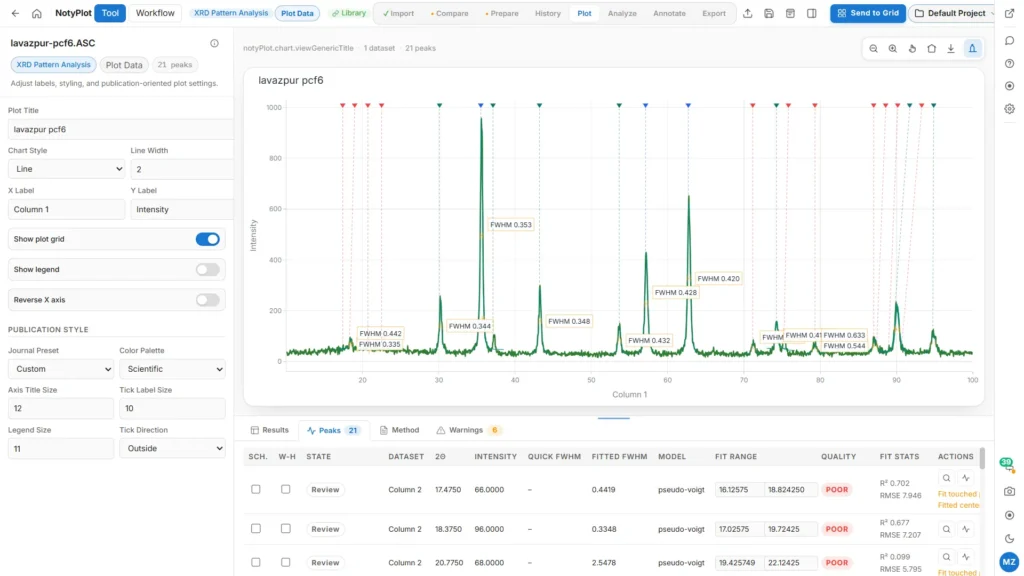
NotyPlot workspace showing an XRD pattern with detected peaks and analysis controls
Review detected peaks and analysis settings before using an XRD result.

Keep the interpretation under your control

NotyPlot can help detect, fit and summarize features, but you remain responsible for checking units, acquisition conditions, preprocessing choices and whether the selected model is scientifically appropriate for your experiment.

Who it is for

  • Researchers plotting XRD, FTIR, Raman, UV-Vis, DSC, TGA, or mechanical data
  • Laboratories comparing multiple experimental datasets
  • Students who need a guided path from raw columns to a clear scientific figure

How it works

  1. Import the data file and review detected workflow, column mapping, warnings, and cleaning steps.
  2. Choose the scientific task, inspect analysis settings or peaks, and compare datasets when needed.
  3. Set axes, annotations, legend, palette, and journal styling; then export the chart and retain the project context.
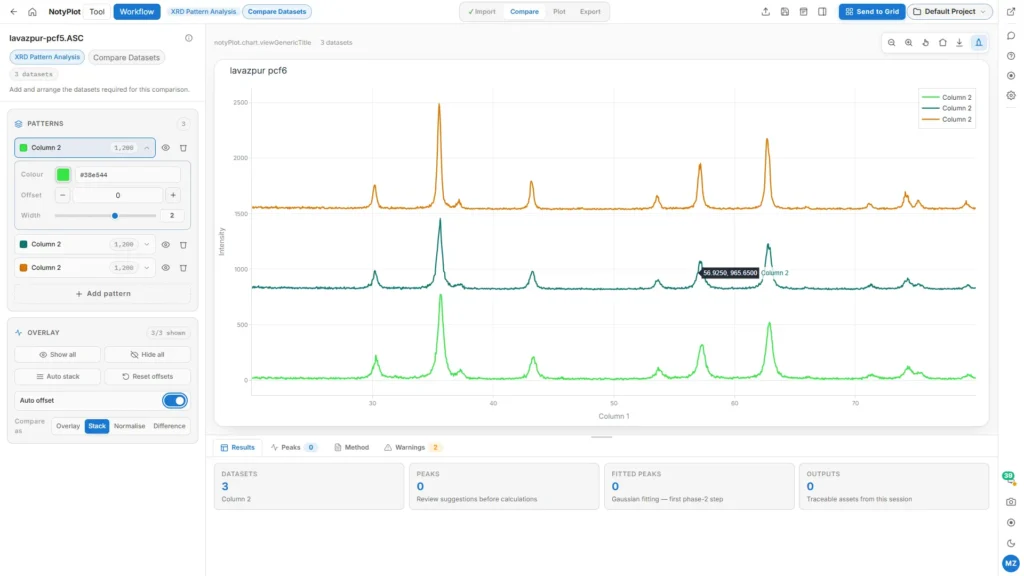
NotyPlot showing multiple aligned experimental datasets in a publication-style chart
Compare datasets with consistent axes, offsets, labels, and visual styling.

Output you can keep

A styled scientific plot and, where supported by the selected workflow, processed data, peak or statistics results, and a reusable project.

Limitations to check

  • Automatic workflow and peak detection are suggestions that require scientific review.
  • Proprietary instrument formats and variants may need an intermediate text or spreadsheet export.
  • Results depend on correct column mapping, units, preprocessing, model choice, and fit quality.

Continue your work

Features

Clean and prepare signals

Review columns and units, then apply supported preprocessing such as baseline correction or smoothing when the selected scientific task requires it.

Detect important features

Find peaks, bands, transitions or other task-specific features and review the detected positions before accepting the result.

Fit peaks and curves

Use supported fitting models for quantitative peak or curve analysis, then inspect fit quality and the extracted parameters.

Extract quantitative results

Work toward results such as peak position, FWHM, area, crystallite size, microstrain, band gap or technique-specific thermal and mechanical properties when supported by the chosen workflow.

Compare datasets

Overlay or compare experimental datasets with consistent axes, sample labels and analysis context.

Create publication-ready plots

Prepare clear axes, legends, labels and annotations, then export a figure suitable for reports, presentations or manuscript preparation.

Who Is This For?

XRD analysis

Detect and fit diffraction peaks, review FWHM, estimate crystallite size and continue to supported XRD workflows such as Williamson-Hall analysis.

Spectroscopy

Review FTIR and Raman signals, find bands or peaks, apply suitable preprocessing and compare spectra between samples.

UV-Vis analysis

Inspect optical data and continue to guided tasks such as Tauc-plot band-gap estimation when the required inputs are available.

Thermal analysis

Review DSC, TGA and DTG curves, inspect transitions or mass-loss events and keep analysis settings connected to the exported plot.

Mechanical data

Plot stress-strain data and extract supported mechanical properties from clearly mapped experimental columns.

Multi-sample comparison

Compare several datasets with consistent labels and axes before preparing a final scientific figure.

Start with a Workflow

These are task-focused entry points to this same Tool module — not separate apps.

XRD auto analysis Analyze an XRD Pattern Run a guided XRD analysis in NotyPlot, inspect detected peaks and fits, and review the results supported by your diffraction pattern. TGA mass loss dtg Analyze TGA Mass Loss and DTG Review mass-loss steps and the DTG curve from TGA data. Inspect temperature ranges and smoothing before reporting decomposition behavior. MECHANICAL mechanical properties Calculate Stress-Strain Properties Review modulus, yield strength and tensile properties from mechanical data. Inspect units and fit regions before accepting results in NotyPlot. PHASE-PERCENTAGE statistics Compare Phase Area Fractions Summarize phase-percentage measurements across images or samples. Check region selection and phase definitions before comparing results. compare Compare Scientific Datasets Overlay or arrange experimental datasets in NotyPlot. Check units, labels and normalization before exporting a clear comparison figure. XRD crystallite size Estimate Crystallite Size with Scherrer Estimate crystallite size from fitted XRD peaks using the Scherrer workflow. Review wavelength, peak widths and model assumptions in NotyPlot. UVVIS band gap Estimate Optical Band Gap Build a Tauc analysis from UV-Vis data, review the fit region and transition assumption, and inspect an optical band-gap estimate in NotyPlot. FTIR find bands Find FTIR Absorption Bands Detect FTIR bands and inspect their positions against the original spectrum. Review baseline and signal orientation before exporting results.

Why use NotyPlot inside NotyLab?

Start with a scientific task, then switch to direct Tool controls when you need them.
Keep plots, analysis settings and saved results connected instead of moving between unrelated utilities.
Compare compatible results from multiple samples in the same research workspace.
Continue from analysis to a publication figure without redrawing the result in a second app.

Frequently Asked Questions

What types of scientific data can I analyze in NotyPlot?

NotyPlot supports task-based workflows for XRD, FTIR, Raman, UV-Vis, thermal data such as DSC and TGA, mechanical data and general scientific datasets. Available calculations depend on the selected workflow and the inputs required by that scientific method.

Can NotyPlot analyze XRD peaks?

Yes. Current NotyPlot workflows include XRD peak detection and fitting, Scherrer crystallite-size estimation, Williamson-Hall analysis and review of XRD phase candidates. You should still verify acquisition conditions, peak selection, instrumental effects and model assumptions before reporting a result.

Does NotyPlot replace scientific interpretation?

No. NotyPlot helps you inspect data, apply supported calculations and review the resulting parameters. Scientific interpretation remains your responsibility, including checking units, preprocessing choices, experimental conditions and whether a fitted model is appropriate.

Can I compare multiple datasets?

Yes. NotyPlot includes workflows for comparing scientific datasets so you can review curves with consistent axes and sample labels before preparing an export.

Can I use NotyPlot for publication figures?

Yes. You can prepare clear plots with labels, legends and annotations and export them for reports or manuscript preparation. Final journal requirements should always be checked before submission.

Is NotyPlot free to try?

NotyPlot is presented as a freemium NotyLab tool. Open the tool to try the available workflow and tool features, then check the Pricing page for the current limits and paid-plan options.

Open NotyPlot in NotyLab

Open the Tool directly. You can switch between Tool and Workflow mode from the toolbar without leaving the module

  • Tool and Workflow in one module
  • Switch mode from the toolbar