
From raw experimental data to interpretable results
Import scientific data, inspect the signal, apply the analysis that matches your technique, and keep the settings and results connected to the plot. NotyPlot is designed for researchers who need more than a chart: it helps you move from raw data to reviewable quantitative results.
Start with the scientific task
Use a guided Workflow when you want a defined result such as XRD peak fitting, Scherrer crystallite size, a Tauc band-gap estimate, FTIR band review, Raman peak detection, TGA/DTG analysis or stress-strain properties. Switch to Tool mode when you want direct control of the plot and analysis settings.
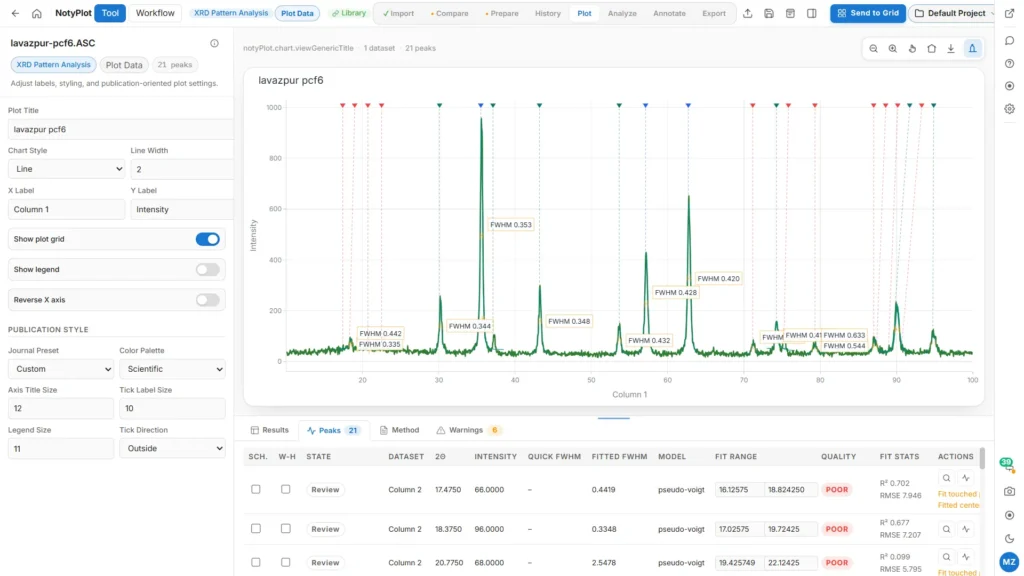
Keep the interpretation under your control
NotyPlot can help detect, fit and summarize features, but you remain responsible for checking units, acquisition conditions, preprocessing choices and whether the selected model is scientifically appropriate for your experiment.
Who it is for
- Researchers plotting XRD, FTIR, Raman, UV-Vis, DSC, TGA, or mechanical data
- Laboratories comparing multiple experimental datasets
- Students who need a guided path from raw columns to a clear scientific figure
How it works
- Import the data file and review detected workflow, column mapping, warnings, and cleaning steps.
- Choose the scientific task, inspect analysis settings or peaks, and compare datasets when needed.
- Set axes, annotations, legend, palette, and journal styling; then export the chart and retain the project context.
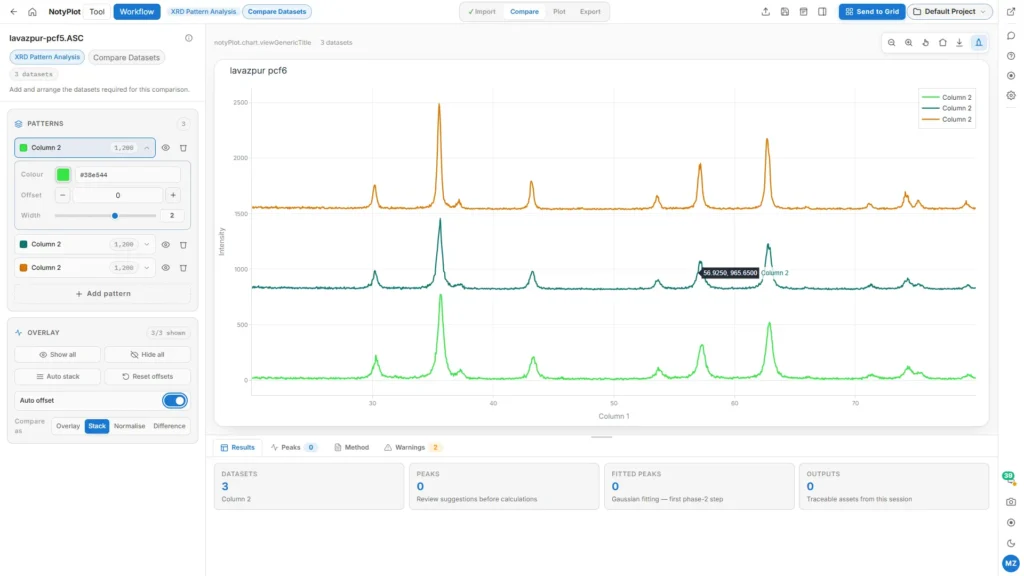
Output you can keep
A styled scientific plot and, where supported by the selected workflow, processed data, peak or statistics results, and a reusable project.
Limitations to check
- Automatic workflow and peak detection are suggestions that require scientific review.
- Proprietary instrument formats and variants may need an intermediate text or spreadsheet export.
- Results depend on correct column mapping, units, preprocessing, model choice, and fit quality.